QGIS Class: Day 4&5 Lesson Plan

QGIS Class Overview

Day 4:

Review

  • I had a access to a smartboard, so I had all of the students gather around (away from their computers) to go over the concepts from Day 3 in a group format. I asked them answer questions about menus and specific purposes of certain functions.

Student Project Work Time

  • Continue with personal project work and one-on-one help.
  • Hopefully all students are ready to print their final map at the end of the day. Since I only had a 8.5×11″ printer in the lab, I opted to have all of the students save a final .tif image at 13×19″ and took it home to print so that they had a larger print to show on Day 5.

Day 5:

Overview

  • Day 5 was just 3 hours long, with a show-and-tell being the last hour. Hopefully the projects are all done, so I did an overview of QGIS concepts learned during the week and explored some of the datasets that the students used for their personal projects. Ask questions about processing, labeling, styling, attributes, etc.

Presentations

  • Parents and others came to the lab and each student presented their project map. I asked them questions about how they processed the data, why they styled it the way they did, what problems they had, etc.

Goodbye!

QGIS Class: Day 3 Lesson Plan

QGIS Class Overview

Day 3:

Review

  • I had a access to a smartboard, so I had all of the students gather around (away from their computers) to go over the concepts from Day 2 in a group format. I asked them answer questions about menus and specific purposes of certain functions.

Vector Selection and Analysis – Hydro

  • Have the students load a far more complicated dataset for analysis. I used the Montana state extract for the USGS NHD (National Hydrography Dataset). Use this opportunity to talk about data scale compared to NaturalEarthData that they have been using.
  • add NHD Flowline, HUC8
  • Have the students select and create a memory layer for a specific HUC8 boundary
  • Clip the statewide flowline dataset to the HUC8 memory layer GDAL>Vector Geoprocessing>Clip vector by mask layer, save as memory layer
  • Have the students use ‘select by expression’ to isolate a specific river, for example: “GNIS_Name” = ‘Bitterroot River’
  • Copy the selected features>Paste them as a new memory layer
  • Calculate the statistics on the new River layer (Vector>Analysis Tools>Calculate Basic Statistics..) and ask the students which statistic tells us the length of the River (sum).

Vector Selection and Analysis – Summits

  • Have the students load a point dataset of mountain summits with an attribute value for elevation.
  • Open the attribute column and show how you can sort a column by clicking on the column header.
  • Ask the students to make a new memory layer of the 10 highest summits. See if they can do it and then talk about the different ways to accomplish this.
  • Use this opportunity to load the matching DEM of the area and use the identify tool to show that the value (meters) of the summits point dataset matches the pixel value of the DEM. Remind them of the difference between raster and vector data.

Vector Selection and Analysis – Fire Perimeters

  • Load a Fire Perimeter dataset. Talk about dataset scale and how this dataset contains overlapping polygons representing every day of a fire. (go into layer styling and reduce the opacity to show the overlaps). Talk about temporal data.
  • Ask the students how to isolate the LAST polygon, representing the final extent of a fire. (attribute table)
  • Have the students select by that attribute, paste as a new memory layer
  • Have the students calculate the statistics on the memory layer and ask them which statistic will tell us the total area burned in a given year.

Data Editing – Review

  • Review the data editing fundamentals that were learned on Day 2.
  • Have the students create a new .shp layer (not a memory layer). Talk about the difference between disk layers and memory layers. Have them create the new shapefile in an organized /data folder. Have them add a ‘Name’ attribute and talk about attribute field types (string, integer, double)
  • Load in a WMS imagery layer
  • Have the students digitize some building footprints in their town.
  • Save the edits, look at the timestamps on the file on the disk as they do this.
  • Save the qgis project and reinforce the difference between the qgis project file and the linked data within a qgis project file.

Student Project Work

  • Now I had the students start to work on their individual projects which they identified on day 2.
  • This involved lots of one-on-one time working through issues for each project and ran the gamut of all sorts of concepts

QGIS Class: Day 2 Lesson Plan

QGIS Class Overview

Day 2:

Review

  • I had a access to a smartboard, so I had all of the students gather around (away from their computers) to go over the concepts from Day 1 in a group format. I asked them answer questions about menus and specific purposes of certain functions.

Map Projections

  • Show a globe and talk about a round-ish earth and what has to happen to made a 2D map of a 3d object.
  • Talk about how different projections preserve different attributes and are designed for different extents.
  • Talk about units and how units are associated with a projection/CRS
  • Zoom in and out with google maps to show the transition from a sphere to a 2d Pseudo-Mercator projection.
  • Load the 50m_admin_0_countries into qgis. Talk about the ‘on-th-fly’ default and how datasets have a CRS, and the map view can have its own. Lots of math happening behind the scenes…
  • Set the map view to EPSG: 3857 and talk about disortion. Note the size of Greenland in relation to South America
  • Set the map view to EPSG: 8857 (Equal Earth) and talk area being preserved. Note the size of Greenland in relation to South America
  • Choose a few other projections and reproject the map view. Use EPSG codes via the qgis search dialogue in order to alleviate errors at this stage. Choose a polar projection and see the data ‘break’

Getting Data from the Internet

  • Talk about getting data from the internet and how it will come in various levels of quality, extents, scales and projections.
  • Adding a WMS basemap layer to QGIS: http://gis.sinica.edu.tw/worldmap/wmts/1.0.0/WMTSCapabilities.xml
    • Add in the imagery layer and zoom around. this is a crowd-pleaser
  • Download Mt.gov geodata
  • Have the students unzip it in the downloads folder, look at the file types, copy it to their Users/Username/data folder and highlight the importance of keeping it organized. Use this oportunity to talk again about data types (.shp, .geodb, .gpkg, .csv)

Geoprocessing Fundamentals

  • Buffers: load a polyline layer (I chose a trails dataset), and create a half-mile buffer dataset. Calculate area of the output polygons via Vector>Analysis>Basic Statistics…
  • Clip: Select a county from the Montana counties dataset, and clip the Montana geology dataset to the the county boundary. Use this opportunity to style the layer, label it, and ask questions about the geology polygons, where are the sedimentary types, where are the igneous?
  • Editing: Introduce the editor toolbar, memory layers and basic editing tools. Make a rectangle and clip the geology layer to the rectangle. Edit some nodes on an existing dataset. Delete by selection tool, Delete by row selection in attribute table, select by expression, delete selected features. Reinforce the concept of a memory layer vs. saving data to disk.

Symbolization

  • Graduated Symbols: Load ne_10m_states_provinces, ne_10m_populated_places, view the attibute table and have the students locate the field for population on the pop_places dataset.
    • Use the styling assistant to setuip the graduated symbols:
    • Layer_styling>simple marker>Size>menu>Assistant…
    • Source: Choose POP_MAX field
    • Refresh
    • Set output sizes from 1 to 10

Collect Field Data

  • Talk about Field Data collection and the three main geometry types (points, lines, and polygons)
  • If the students have smartphones, have them install the Input app and have them all login to the same username and password that you have previously setup.
  • Using the default project, or one that you have setup with that account, head out into the field and have them all collect data, points, lines, and polygons and take some geotagged pictures as well. Have them all sync the data to the public mergin cloud.
  • Back in the lab, have all of the students install the Mergin plugin via the QGIS Plugins menu.
  • Have them all login to the same account, load the project locally, and then sync all of the data.
  • Explore the data that they have collected, look at the attribute tables, and show them how a geotagged photo has the filename in the attribute table and the photo with the matching filename is also stored in the mergin project folder.

Personal Project Outline

  • Have the students fill out the personal project worksheet. Talk about them afterwards.
  • On this night, I had to source some custom datasets from the internet that each student would need to complete their project. Give them links if possible so that the student has to download, unzip and organize the data into their project.

Print Composer

  • Introduce the Print Composer and explain that it is a different window, but linked to the main qgis window.
    • New Print Layout>Name it for the paper size
    • Right-Click on the page>Page Properties>Set US Letter Page Size
    • Add Map
    • Move tool (layout manipulation)
    • Move Content Tool (set map extent and scale) #make sure they understand this tool difference
    • Scale, North Arrow, Title, Legend, Shapes, Attribute Table
    • Have the students style and print a 8.5×11″ map to the color printer using a selection of the datasets that they have active in qgis (pop_places, geology, etc.)

QGIS Class: Day 1 Lesson Plan

QGIS Class Overview

Day 1:

Talk together, away from computers

  • Names and Intro #say name, adjective that describes you, and something fun you have planned for the summer
  • Icebreaker game: rip up shapes behind your back
    • Everyone has to blindly rip out an elephant behind their back, who has the best one?
    • Everyone has to think of a US State and rip it out of a sheet of paper behind their back, can anyone identify it?
  • Page through the NatGeo Atlas of the World and talk about different types of maps
    • Physical versus Cultural, what data is used on each type
    • Thematic maps
    • General reference maps
    • Map Styles, Visual Hierarchy
  • Look at other maps
    • Aviation map: #can anyone guess what it is used for? What are the physical features and Cultural features on the map?
    • Trail Map
    • Weather Map
    • Plant Hardiness
  • Have Students Complete the Intro Questions worksheet

Students at Computers: QGIS Fundamentals

  • Setup Workspace panels so everyone has the same view #I made them all use the format that I use myself, that is Layers, Browser, Layer Styling, and Processing Toolbox all docked together on the left, tabs at the bottom:
  • Add Data from Browser tab. Have the NaturalEarthData full geopackage loaded on each machine. Talk about the concept of a file on the hard drive and how the QGIS browser is just an index (link) to the actual file. This is assuming that this has been preloaded into each student’s user folder
    • Load 10-Million scale Countries, States, Populated Places, Rivers, Ocean
  • Zoom Tool
  • Scale readout (in relation to zoom)
  • Measure tool
  • Layer Ordering
  • Layer Visibility Toggling
  • Layer Selecting (In the Layers panel)
  • Styling features (live from the Layer Styling tab)
  • Accessing attribute tables
  • Filtering features in a layer
  • Zooming to a layer
  • Select Tool (Drag a box, Single Select, Select by attribute rows)
  • Copy selected features
  • Paste features as a temporary scratch layer (talk about the concept of a memory layer and how it related to geoprocessing fundamentals)
  • Labeling Features (lookup attribute table column to connect the concept)

Raster Versus Vector

To explain the difference between raster and vector, load the USDA plant hardiness geotiff and the vectorized plant hardiness map to see the difference between the two types of data

  • Talk about pixels (jpeg/low-res image example) and vector (points creating shapes with math to create objects)
  • Why use a raster dataset? #continuous data, more detail, each cell has a value
  • Why use a vector dataset? #generalized (grouped) values, easier to use with many geoprocessing tools

Raster Processing – Elevation

Now that the concept of a raster dataset is established, load a 1 arc second NED DEM, (projected to UTM zone in meters)

  • Using the Identify Tool, click on a valley to read the elevation and then a peak to read the elevation #reinforce raster concepts
  • Create a contour dataset (Processing Toolbox>GDAL>Raster Extraction>Contour) #talk about how vector datasets can be created from raster datasets
  • Create a hillshade (Processing Toolbox>GDAL>Raster Analysis>Hillshade) #talk about how vector datasets can be created from raster datasets

Joining Attribute Data

To introduce students to the concept of a join, we will join some US vehicle crash fataility data to the ne_10m_states_provinces dataset.

  • First, talk about the structure of a shapefile on a hard drive, (.shp, .dbf, and .shx) note the purpose of each file type
  • Open a .csv of the crash data in notepad and talk about what a .csv is–‘flat’ data. Note that the commas create columns
  • Open the attribute table for the ne_10m_states_provinces dataset and have the students identify a column that matches in the .csv
  • Have the students add the .csv from the qgis browser. Reinforce the concept of ‘flat’ non-spatial data denoted by the icon. nothing draws in the map view.
  • Have the students create the join
  • Then look at the attribute table to see the joined columns
  • Have the students symbolize the ne_10m_states_provinces dataset using the Deaths-per-100000-population dataset. Talk about Graduated symbolization, data ‘buckets’, and number of classes
  • Use a liner color ramp and have the students interpret it and ask then what they notice about the map they just made. Why are there low numbers in the Northeast even though there are far more people and cars than many of the other states?

Teaching an intro QGIS class for high schoolers

TLDR: Though there are immense hurdles these days in terms of devices and media to distract them, the kids are alright.

About a week ago I taught an intro to qgis class through the Coding For Kids program in Stevensville, Montana. As a mid-30s guy with exactly zero kids and pretty much zero contact with kids of this age range, the biggest question on my mind going into it was where to start and what level of general computer and complex application literacy they would have. I spent my high school years building PC’s–tearing them apart to install video cards and LANing them together with my friends so we could play countersrike without 56k modem lag. Needless to say, things are different in 2021–would I be teaching them how to unzip files and navigate a file browser, or would we all be happily learning about different geoprocessing tools by day two? I mean, the kids and their tik tok these days, amirite?

So there I was, days before the class started, hemming and hawing about where to start the curriculum so as to not be boring but not overwhelm the students too early general computer literacy was a roadblock. With 6 students ranging from 8th grade to a graduated senior, I was at a loss.

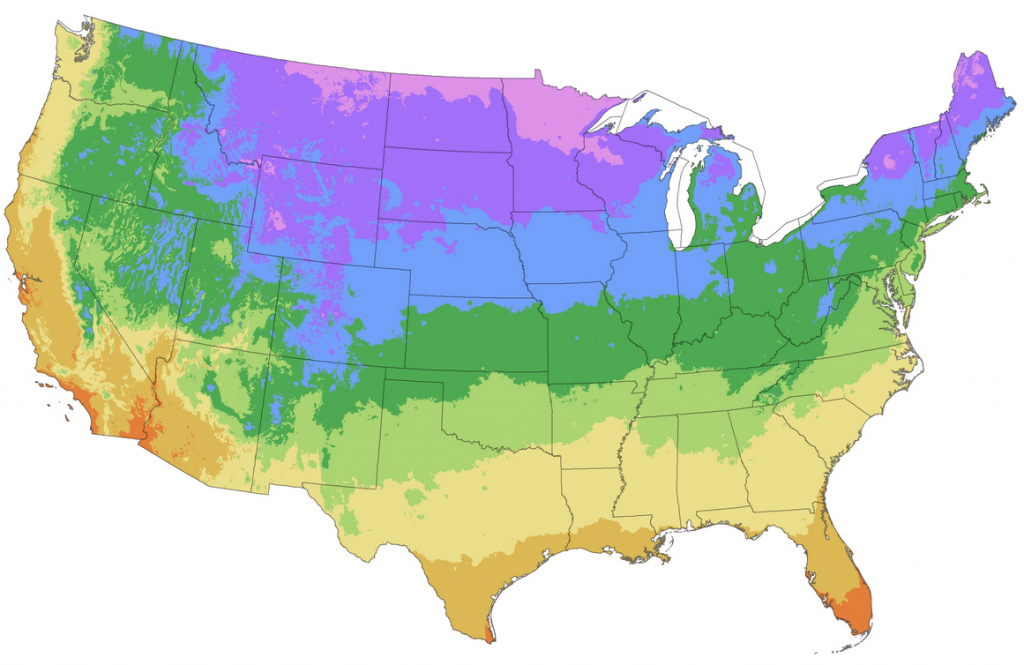
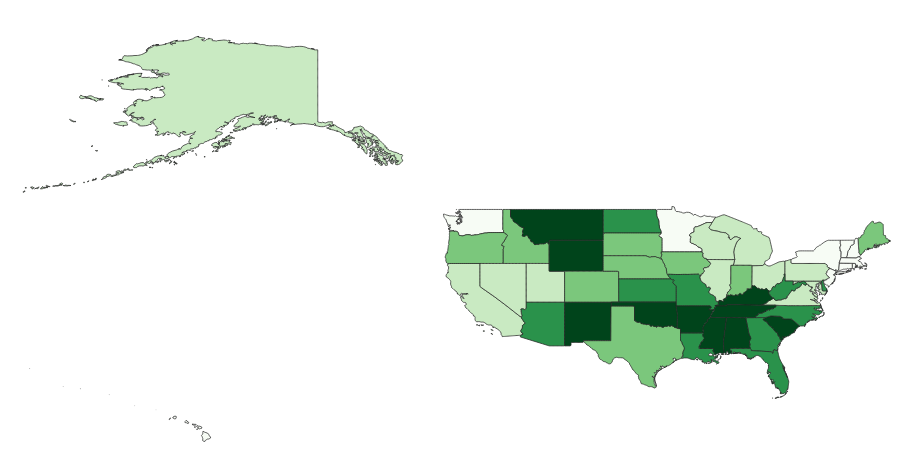
Monday morning came and it was time to get cracking! The 6 students all seemed excited to be there and energized about learning something new. We started off with a few classic icebreakers and intros, talked about maps and what they knew about maps in general, but pretty quickly we got down to business and got going with QGIS. The students exceeded all expectations that I had and picked up some of the fundamental concepts pretty easily and by and large didn’t have any of the computer/file-management knowledge that I was (irrationally) concerned about. We covered geoprocessing, styling maps, projections, joining data and so much more! I’ve added the lesson plans here for those that would like to see the material that was covered. The students worked through the material quite quickly and had me scrambling a little bit for new curriculum later in the week. Below is what we accomplished through 5 days of class, 5 hours each day (3 on the last day).

Takeaways

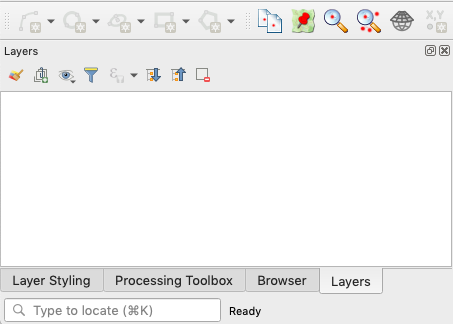
  • QGIS is amazing. I’ve been using qgis for a really long time and it used to have all kinds of stability and usability issues. Now, it is so stable, so user-friendly, that I use it professionally and it was also great for teaching.
  • Natural Earth Data is amazing. I don’ even know what the cartography community did before this was a thing. Oh waut,es I do, everyone spent hours scrambling around for random datasets to create basic maps that never quite aligned properly and it was a mess. This dataset is so good, so lean, that it is always a joy to use professionally as well as a teaching aid.
  • Maps are amazing – I love maps–always have. I live and breathe them and it is always exciting to see young people light up when they make connections to maps and the curtain for how they are made is pulled back. It was so rewarding to see various concepts click and for the students to take off down a tangent exploring the possibilities.

Lessons Learned

  • Phone Apps – I went to high school in a world of land lines and giant rolls of clear film with days of class work being pulled across an overhead projector. Smartphones and social media apps were not a thing, and for that I am grateful. The addiction to to social media apps is real, and phones were the most counter-productive force in my classroom. 5 of the 6 students would be sticking with me and following along, but one would be scrolling their phone, and then when they came back to reality, I would have to go over and individually catch them up. While I was doing this, the other students would pull their phones out during the downtime. Ugh. If I do this again, I will make a cell phone policy clear at the beginning and also be a little more hip on the ’20-minute bathroom break’, which I now see was just a cover for a phone scroll session. Need to go to the bathroom?–phone stays in the room.
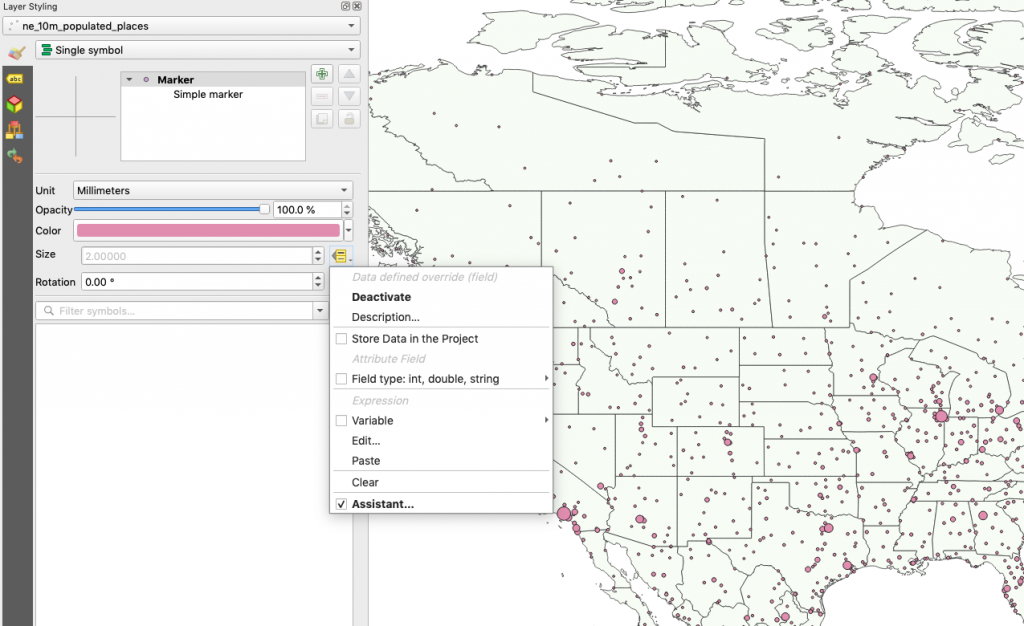
  • Map Styling – I use Adobe Illustrator to create maps and use qgis largely for analysis and geoprocessing. I use basic styles, but really stick to the rudimentary stuff. I should have known this, but the students were really keen on styling the maps. I need to learn more about advanced styles and how to make that part more engaging. Also, some of the default style options in QGIS can be pretty horrid, so guiding them to some more reasonable choices would be a good start.
  • Lab Data Persistence – The lab that was graciously provided for the class was a public school lab that had software which wiped out the user folder each night. Microsoft ‘one-drive’ was available, but it required re-syncing data each morning and caused all sorts of linking issues with data and qgis project documents. Make sure that there is a stable place for students to store data, either a network share or a usb flash drive for each student. (I ended up setting up a flash drive for each student)

Conclusion

It was a fun week and I’m impressed with how the students did. If you are here because you’re also going to be teaching QGIS, let me know if any of this was useful!